Relative Deficiencies
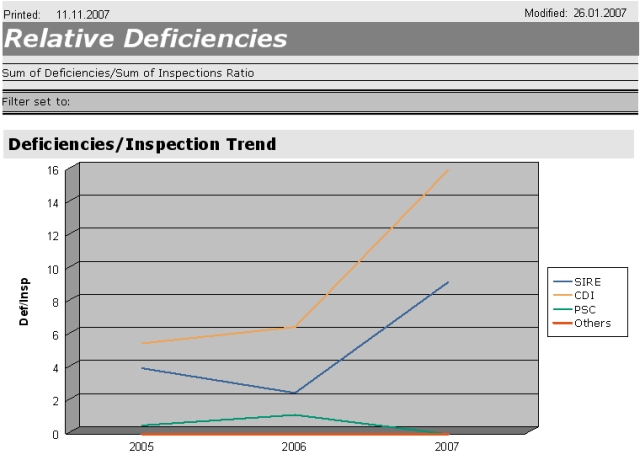
deficiencies divided by inspections
This report shows a trend of the fleet performance regarding vetting inspections. The sum of deficiencies id divided by the sum of inspections for each year and grouped by report types CDI, SIRE and PSC. There are more pages behind showing the calculation of the relative deficiencies in tables.
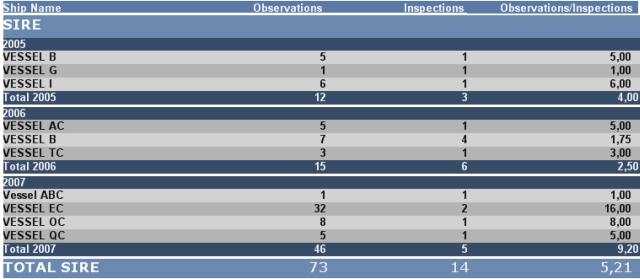
calculation example SIRE
The table groups the inspection by report type, in this example SIRE and by year. Each vessel represents one line. Each line shows the sum of observations for the year (column Observations) and the sum of inspections for the year (column Inspections). Observation column is dived by the inspection column (Observations/Inspections). The summary for all ships can be found in the Total for the year. These yearly values are shown in the graph (see above).